My projects at Exem
Saturday, June 28, 2025
Projects at Exem
This is a rundown of some of the projects I worked on at Exem, a company specializing in electromagnetic field exposure measurements. Most of these projects were developed for internal use, so they aren't publicly accessible, but I can tell you about what I worked on and what I built!
About Exem
Exem's core mission is to measure electromagnetic field exposure for both private and professional clients. We operated in homes, businesses, and industrial sites, and handled over 10.000 measurements annually. Due to the volume and complexity of data, we had to create automated and flexible systems capable of managing large datasets with minimal human input.
Internal tools: Measurement handling
After each measurement, the first step was validating data before generating a report for the client. These measurements were collected using an in-house Android app, but the raw data wasn't practical for validators to work with directly.
One of my first projects was to develop a web-based validation platform:
- Built with Flask for the python back-end
- Front-end in vanilla HTML, CSS, and JS
- Able to parse and format raw measurements into a human readable interface
- Enabled real-time editing and automatic PDF report generation
The back-end included a rule-based pre-validation system to catch anomalies (like incorrect measurements height or unrealistic values for a given service like radio or 5G). This meant validators only had to confirm or adjust flagged errors. Once validated, a pipeline did the rest:
1. Generated an editable HTML version of the report using Puppeteer
2. Converted it to PDF
3. Automatically delivered it to the client the next day by email
Internal tools: Data Storage & Analytics
All validated measurements needed to be archived and analyzed for reporting and business intelligence. I designed a system where:
- Each measurement was converted to a structured JSON
- Data was stored in BigQuery, GCP's data warehouse solution
- Connected to LookerStudio to enable dashboarding and visualization
The process of saving data to BigQuery was handled by Cloud Functions, ensuring scalability and automation.
Public-Facing Tools: Real-Time Sensor Data
In addition to on-site measurements, Exem also developed custom sensors sold to cities for continuous monitoring of electromagnetic exposure in public spaces. With over 400 sensors deployed (each generating ~24 reading per day), the data volume was significant.
In worked on:
- Ingesting and storing time-series data from sensors using a dedicated time-series database, GCP's BigTable solution
- Caching recent data in Firestore to reduce the load of more complex queries, such as computing averages or detecting spikes
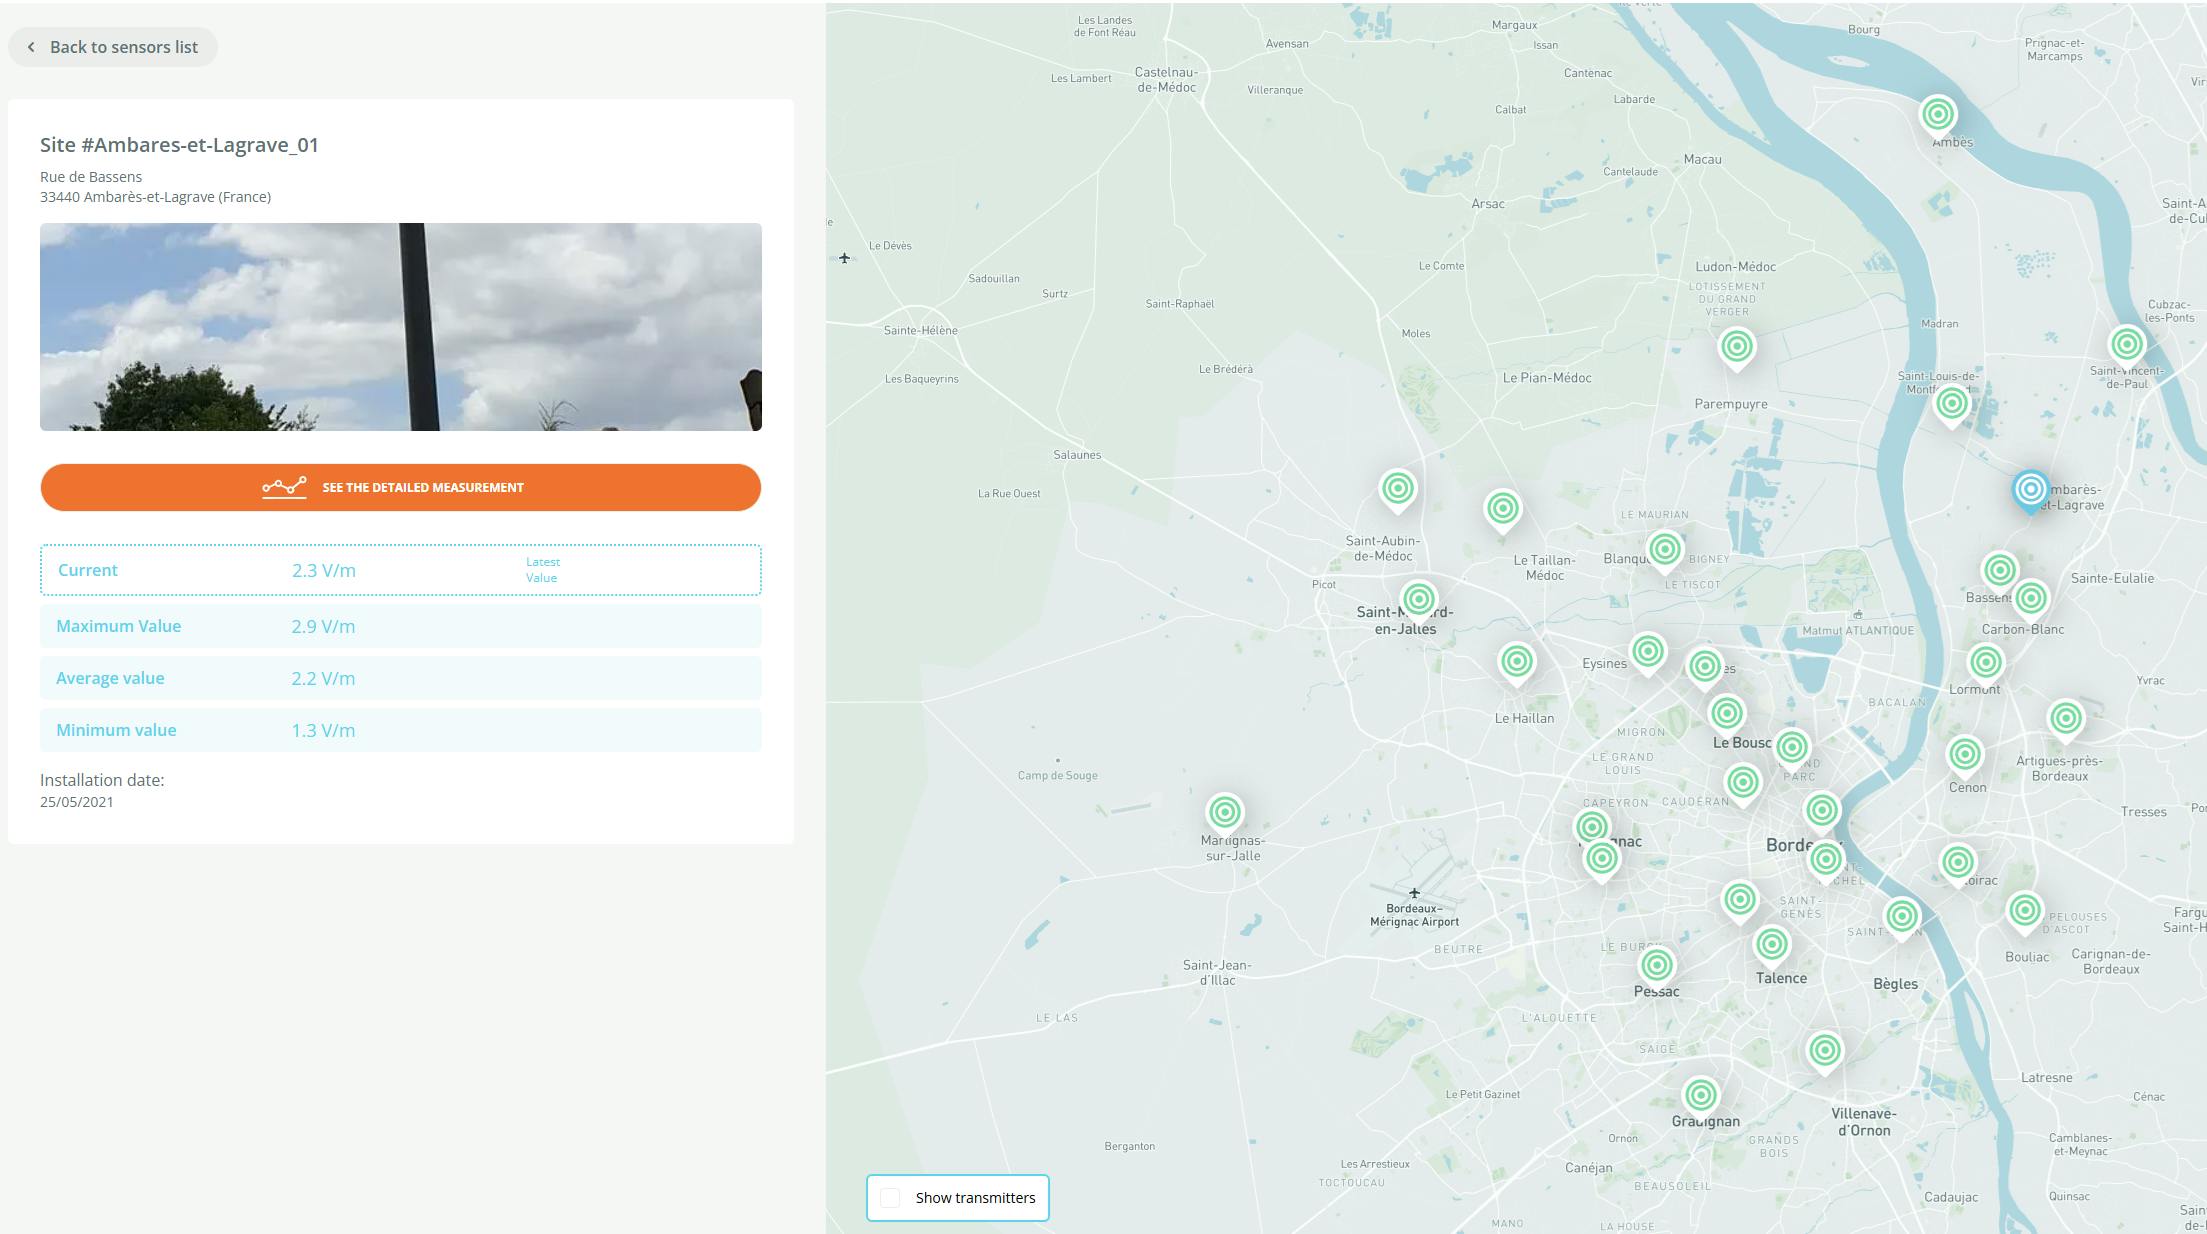
The system powered a public-facing website that allowed users to view:
- Historical data for each sensor
- Interactive graphs since each sensor's installation
- In depth analysis allowing for the combination of multiple sensors' values
IoT Integration & Backend Architecture
Because the sensors relied on low bandwidth IoT networks, the data they sent had to be encrypted and minimal. I worked on:
- Connecting sensors directly to GCP Cloud Functions
- Handling the decoding and database insertion serverlessly, reducing back-end load
The core backed was built with Django, and served as:
- An API for the website
- An admin interface for Exem employees, allowing for the management of sensors, alarms, and inventory
Here is a screenshot of the public version of our website, that allowed french citizens to check EMF exposure in real time:
Route Optimization with Graph Theory
One internal project involved optimizing bike routes for field technicians. We offered a service where a technician would ride throughout a city using a custom sensor that captured real-time electromagnetic field (EMF) measurements, allowing us to map EMF exposure across the entire area. To ensure full city coverage while minimizing travel time, I applied graph theory concepts, particularly Dijkstra’s and A* algorithms, to compute optimal routes.
I also handled data visualization using Mapbox and OpenStreetMap, enabling users to explore the collected data directly on an interactive map. A 3D view of the city was also available, allowing users to compare exposure levels with the positions of EMF emitters, which were retrieved from a PostGIS database.
Technologies I used
- Front-end: HTML, CSS, JS, Svelte
- Back-end: Flask, Django, Java
- Cloud Infrastructure: GCP (Cloud Functions, Cloud Run, Cloud Build)
- Visualization: Looker Studio
- Databases: Firestore, BigQuery, BigTable, PGSQL
- Automation: Serverless pipelines, Gitlab CI/CD
- And much more: PostGIS integration, Big Data analytics, Graph theory...